
Cloud
The Hidden Costs of Cloud Migrationfor Mid-Sized Businesses
Hidden Costs of Cloud Migration for Mid-Sized Businesses Home Cloud
Discover the hidden workflow bottlenecks slowing your dev team. Actionable insights on context switching, CI/CD delays, and tool sprawl for IT professionals.
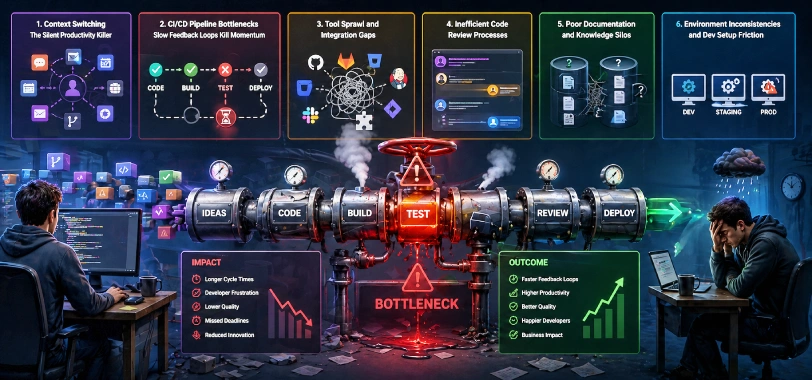
In today's fast-moving software landscape, organizations invest heavily in developer tooling, agile methodologies, and skilled engineering talent. Yet despite these investments, development velocity continues to fall short of expectations. The culprit is rarely visible on dashboards or sprint reports; it lies in hidden workflow bottlenecks that quietly erode developer productivity, day after day.
For IT professionals and engineering managers, identifying and eliminating these friction points is one of the highest-leverage actions you can take. This guide exposes the most pervasive hidden bottlenecks and provides a clear, actionable path forward.
Context switching is arguably the most underestimated developer productivity problem in modern software engineering. When developers are pulled from deep work into Slack messages, ad hoc meetings, or urgent bug tickets, the cost isn't just the interruption itself — it's the recovery time.
According to research from University of California, Irvine, it takes an average of 23 minutes and 15 seconds to fully regain focus after an interruption. For developers working on complex logic, this number can be even higher.
Common sources of context switching include:
Implement "Deep Work" blocks of 2–4 uninterrupted hours per day. Use asynchronous-first communication norms and leverage tools like linear.app or GitHub Projects to centralize task visibility and reduce ping fatigue.
Continuous Integration and Continuous Deployment (CI/CD) pipelines are the backbone of modern DevOps workflows. Yet poorly optimized pipelines introduce one of the most damaging developer workflow bottlenecks: slow feedback loops.
When builds take 20, 30, or even 45+ minutes, developers don't wait — they context switch. And when they return, they face merge conflicts, stale branches, and failed tests they must triage from scratch.
Key CI/CD Bottleneck Patterns
Monolithic test suites with no parallelization or test sharding
Lack of caching for dependencies, Docker layers, or build artifacts
Sequential pipeline stages that could be parallelized
Insufficient compute resources causing queue delays during peak hours
Flaky tests that randomly fail, eroding trust in the pipeline
Elite DevOps teams, as defined by the DORA State of DevOps Report, achieve deployment frequencies of multiple times per day with change failure rates below 5%. Slow CI/CD pipelines are a primary barrier to reaching this performance tier.
Action Item
Audit your current pipeline stage durations. Introduce test parallelization, dependency caching, and consider migrating to self-hosted runners or more performant CI infrastructure such as BuildKite or GitHub Actions with larger compute options.
Modern development teams operate across an ever-growing ecosystem of tools: IDEs, version control platforms, project management software, monitoring dashboards, security scanners, documentation wikis, and communication platforms. When these tools don't integrate seamlessly, they create invisible tax on every developer's workflow.
The result is what many engineering leaders call "tool sprawl" — a state where developers spend more time navigating between disjointed systems than actually writing and shipping code.
Signs Your Team Suffers from Tool Sprawl
Developers manually copy information between Jira tickets and GitHub pull requests
Release notes must be assembled by hand from multiple data sources
Security alerts from one tool don't automatically create tickets in another
Onboarding new engineers takes weeks due to disconnected toolchain documentation
Metrics live in silos — no single pane of glass for engineering KPIs
Invest in platform engineering. A dedicated internal developer platform (IDP) that integrates your CI/CD, monitoring, incident management, and deployment workflows can reduce cognitive overhead by up to 40%, according to Gartner research on developer experience.
Code review is essential for maintaining quality and knowledge sharing across engineering teams. However, when review processes are poorly structured, they become a significant developer productivity bottleneck — introducing delays, creating knowledge silos, and generating friction between contributors.
Common Code Review Anti-Patterns
Overly large pull requests (PRs) that take hours to review
Single reviewer dependencies — one senior engineer becoming a bottleneck
Lack of automated linting, formatting, and static analysis (reviewers doing bot work)
Review feedback cycles that span multiple days due to unclear SLAs
No structured review checklists, leading to inconsistent feedback quality
Best-in-class engineering organizations enforce PR size limits (typically under 400 lines of changed code), use CODEOWNERS files in GitHub to automatically route reviews, and implement automated quality gates that eliminate low-value review comments entirely.
Tribal knowledge — information that lives only in the minds of individual developers — is one of the most persistent hidden workflow bottlenecks in software engineering. When key architectural decisions, system behaviors, and troubleshooting procedures aren't documented, every new bug or onboarding exercise requires locating the one person who knows the answer.
Stack Overflow's Developer Survey consistently finds that searching for answers and dealing with unclear or absent documentation accounts for a significant portion of unproductive developer time. Knowledge silos don't just slow individuals — they create organizational fragility.
Effective documentation strategies for IT teams:
"It works on my machine" is more than a developer meme — it represents a genuine and costly class of software development bottlenecks. Inconsistent development environments, complex setup procedures, and infrastructure drift between local, staging, and production environments consume enormous amounts of engineering time.
Solutions That Leading Engineering Teams Use
Docker and Docker Compose for standardized, reproducible local development environments
Dev containers (VS Code Dev Containers spec) to eliminate "works on my machine" entirely
Infrastructure-as-Code (IaC) tools like Terraform to eliminate environment drift
Cloud Development Environments (CDEs) such as Gitpod or GitHub Codespaces for instant, consistent onboarding
| Bottleneck Type | Warning Signal | First Action |
|---|---|---|
| Context Switching | Developers report "always interrupted" | Implement async-first comms policy |
| CI/CD Slowness | Build times exceed 15 minutes | Profile pipeline, add caching & parallelism |
| Tool Sprawl | Onboarding takes 2+ weeks | Invest in internal developer platform |
| Code Review Delays | PRs open for 48+ hours | Set review SLAs, enforce PR size limits |
| Knowledge Silos | Same questions asked repeatedly | Launch docs-as-code + ADR practice |
| Env Inconsistencies | Dev/staging environment mismatch bugs | Adopt Dev Containers or CDEs |
Measuring developer productivity requires moving beyond lines of code and ticket velocity. The SPACE framework — Satisfaction, Performance, Activity, Communication, and Efficiency — developed by researchers at Microsoft and GitHub, provides a multidimensional approach that captures both quantitative and qualitative signals.
Key metrics to track for hidden bottleneck detection:
Deployment frequency, lead time for changes, change failure rate, mean time to recovery
Time from PR opened to merge — a direct bottleneck signal
Ratio of active work time to total elapsed time per ticket
Scores via regular internal NPS surveys
How long work sits in each Kanban column
Hidden workflow bottlenecks don't announce themselves — they accumulate quietly until your best engineers are spending more time fighting friction than building the future. For IT professionals leading engineering organizations, the competitive advantage lies in systematically identifying and eliminating this invisible drag.
Start with one bottleneck area. Run a focused audit using the framework above. Measure baseline metrics, implement targeted changes, and track the delta. Small, consistent improvements compound into transformative engineering velocity over time.
The fastest team isn't the one that works harder; it's the one that removes friction smarter. Eliminate hidden bottlenecks and unlock your team's true productivity potential.
Context switching, slow CI/CD pipelines, tool sprawl, delayed code reviews, and poor documentation reduce developer productivity over time.
Frequent interruptions break focus and slow down development. Structured communication and dedicated work time help reduce this impact.
They delay feedback cycles, disrupt development flow, and increase rework. Faster, reliable pipelines improve efficiency.
Using multiple disconnected tools creates friction and slows execution. A unified platform improves workflow efficiency.
Start with a workflow audit — measure key metrics, identify delays, and prioritize fixes based on impact.
Transform your engineering velocity with expert DevOps and workflow optimization from Nemo IT Solutions.
Get Started TodayHidden Costs of Cloud Migration for Mid-Sized Businesses Home Cloud

Ambient Intelligence: The Next Frontier in Smart Technology Home Smart

Hidden Workflow Bottlenecks Slowing Down Developer Productivity Home Developer Productivity
Give us a call or fill in the form below and we’ll contact you. We endeavor to answer all inquiries within 24 hours on business days.